Intro
When trying the new Atlus game Metaphor: Refantazio, it came to me that the performance on steam deck was sub-standard for the kind of graphics this game has. While it has a great art-style, the performance does not meet the techniques seen on it, as it seems to come from persona 5 engine which ran on a PS3. For this reason, i captured a few different scenes, and analysed the result, to try to see what is the cause for such a performance.
My focus here is on the Steam Deck gpu in particular, and how the rendering techniques seen in this game work for it. The game focuses on PS5 and PC, and does not target Steam Deck in particular, but the Steam Deck provides a good proxy for a mid range/low end GPU, and it has very nice performance measuring tools we can use on it. The workflow explained here is usable for vkguide code too, and you can see how the techniques run on-device.
Performance analysis workflow
The analysis will be done with 2 main tools. First one is RenderDoc https://renderdoc.org , and the second one is Radeon GPU Profiler https://gpuopen.com/rgp/ . Renderdoc will let us replay the frame drawcall by drawcall, and check what exactly happens during the frame, while Radeon Profiler will give us the timings for the commands executed and information about them. By comparing the same capture on both programs, we can see what goes on and what specific draws are slow/fast on them.
The Steam Deck uses a Van Gogh integrated GPU by AMD, as part of a chip alongside the CPU. It uses the same memory for both CPU and GPU. Its main weakness is that its a fairly small gpu (as all integrated gpus are), and that its memory bandwidth is fairly bad as it uses normal DDR ram instead of the faster GDDR seen on dedicated GPUs. Its similar to something like the PS4 GPU in architecture due to this shared memory scheme. While the GPU is small, its a modern GPU, and supports most of the latest features in vulkan. Both versions of the vkguide tutorial work on it unchanged.
The Steam Deck renders at a low resolution of 1280x800p which lets it still run somewhat OK even with its low memory bandwidth.
To test the performance of this game, I’ve captured 3 different scenes from the game. The first playable area of a desert, a small but dense rest area in a forest, and the main city at night. All of these are found within a couple hours of starting the demo.
Keep in mind this article is written on 08/10/2024 and on the demo version of the game. Its possible that the developers improve things from here on the final version, or on patches later. The game does not use vulkan natively, but the translation layers in the steamdeck Proton system translate the directx11 it uses to Vulkan, which we can analyze. There is a bit of strange stuff in renderdoc due to this, like strange usage of render passes, but its fine and these systems are highly optimized.
Frame analysis
Lets begin with the game, checking what exactly goes on in a frame, and how the game renders its world.
Here are images of the 3 scenes for the analysis. We will focus on the City one as its more interesting, but the other 2 will be used to compare performance in different areas. The game has no graphical settings other than ambient occlusion on/off, we are keeping it on. Native resolution at 100% scaling
The desert area looks like this. We have a open space, with a bunch of transparent dust effects, and a terrain, with the main character on it. 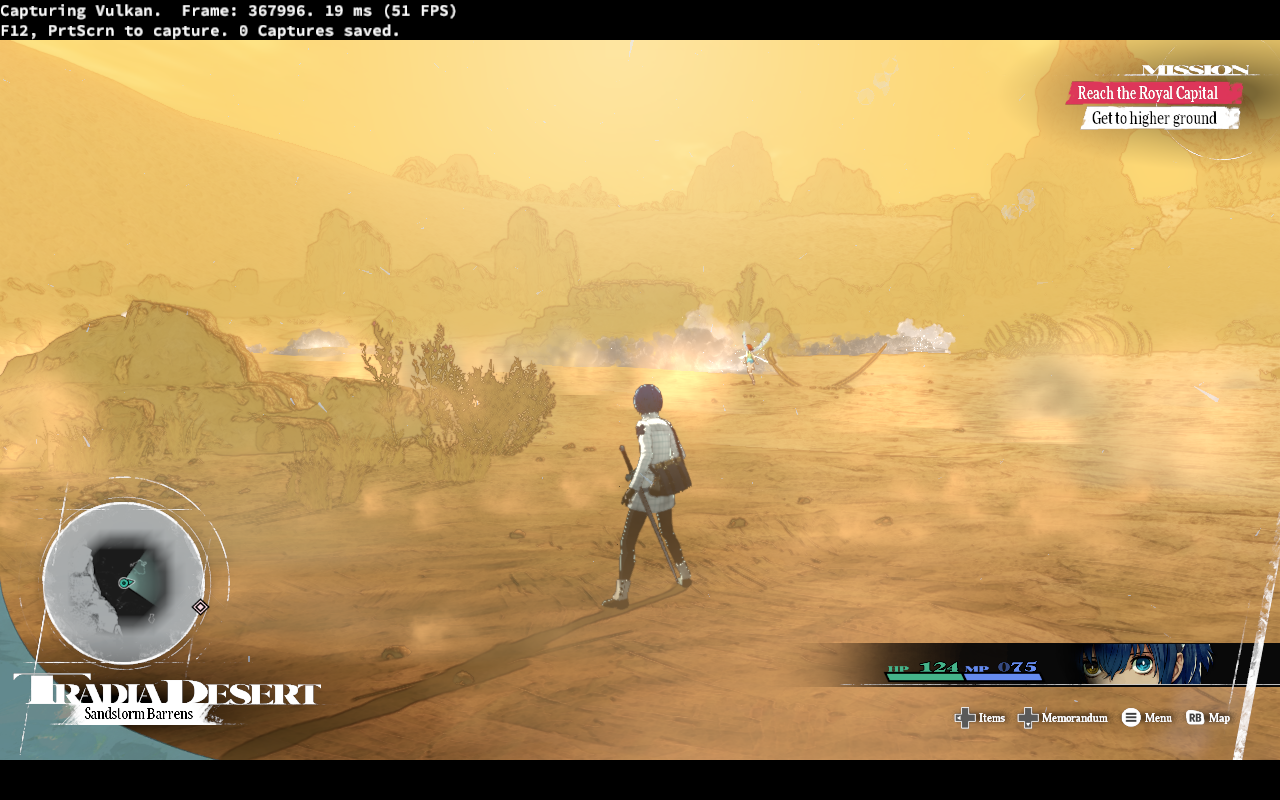 Runs at ~45 FPS
The rest area in the forest looks like this. Very small map, with a few characters sitting at a bonfire. 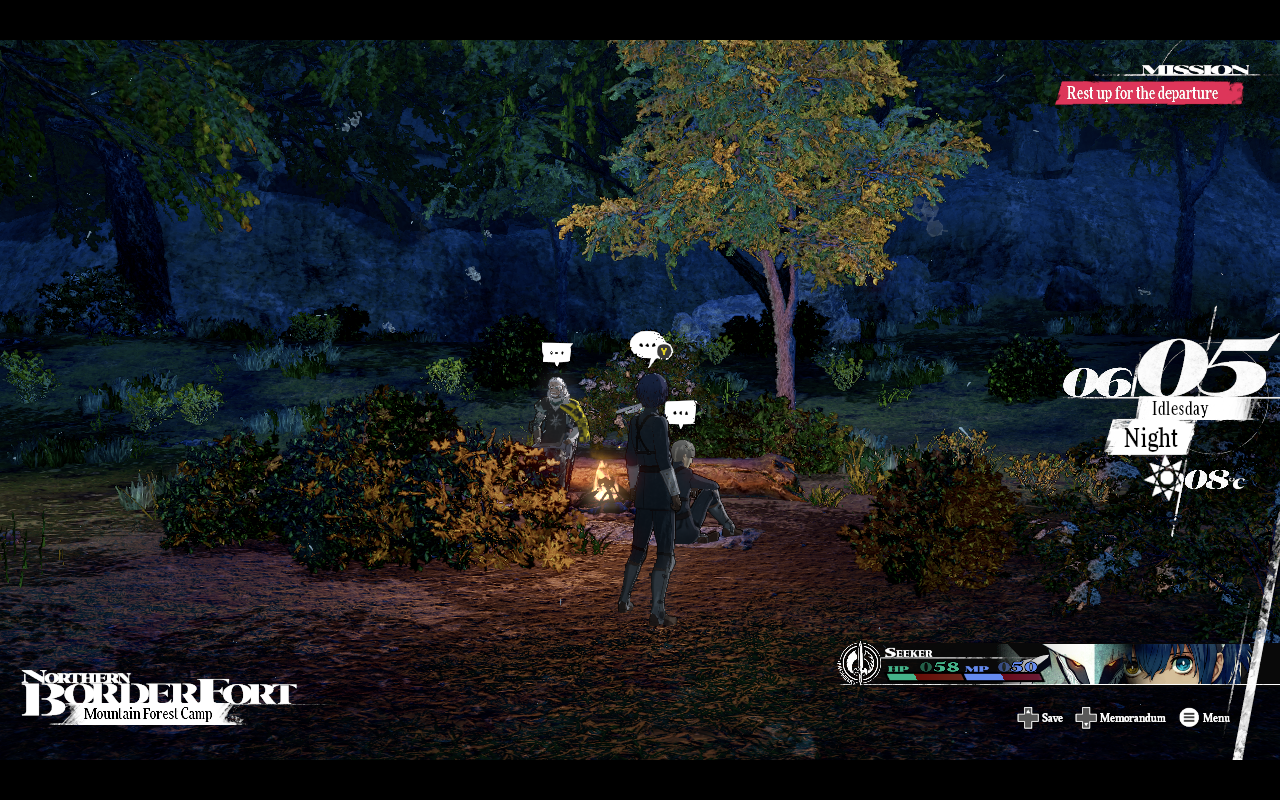 Runs at ~40 FPS
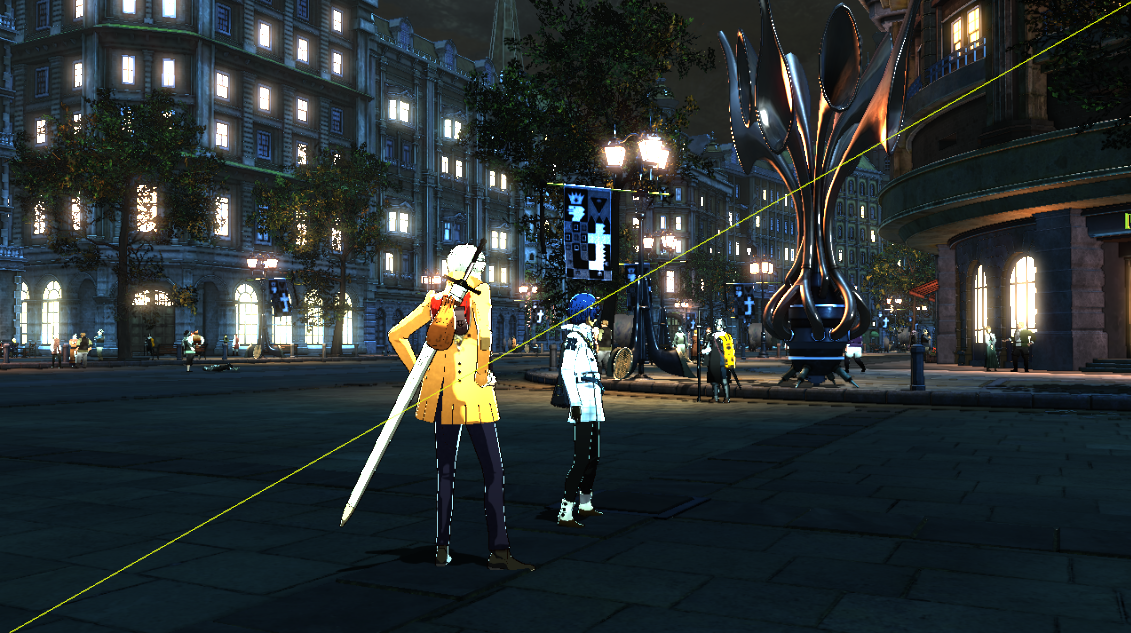
Lastly, we have the City. Large map, with tons of objects on it, and a lot of characters walking around. We also have a bit of text on it. 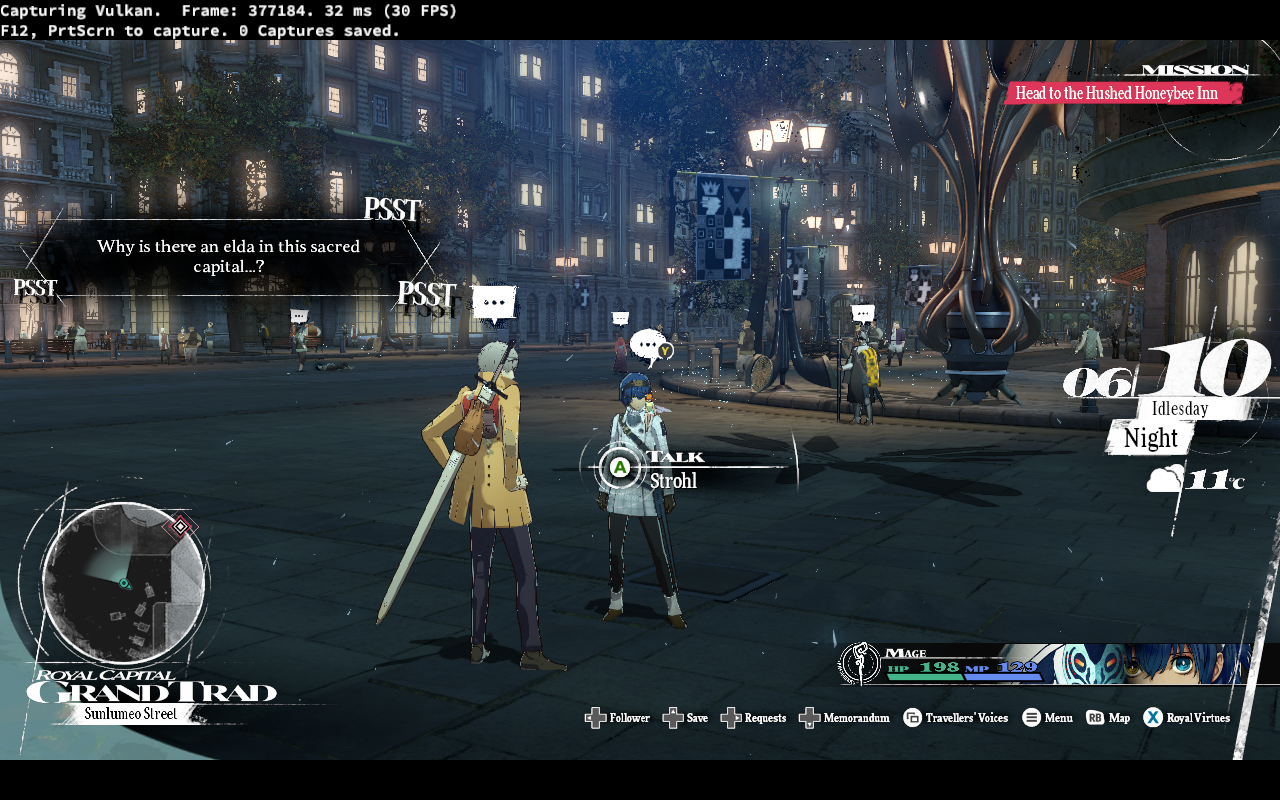 Runs at ~30 FPS
These 3 areas run slow for different reasons, but they have some parts in common. In other zones like dungeons or combat scenes, the game keeps 60 FPS.
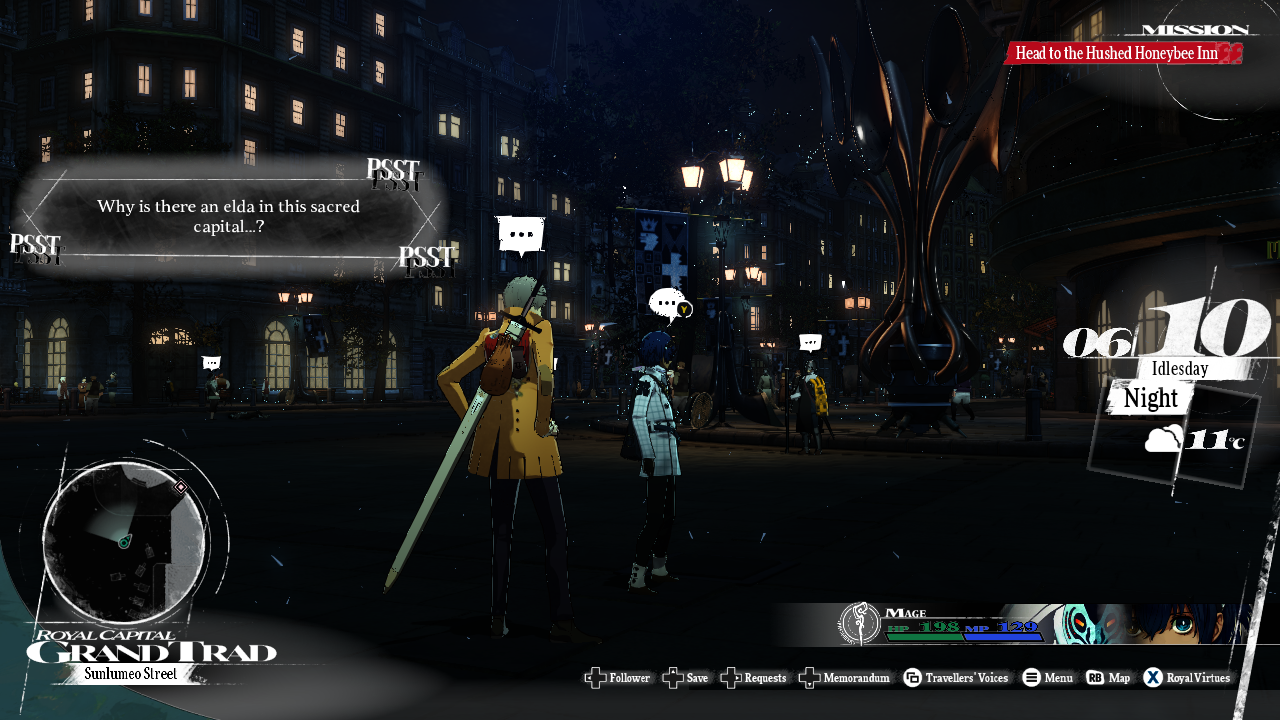
Capture the scene in renderdoc using steam deck debug/dev utilities, and lets look at that City to see what the game is doing.
We can see this in renderdoc 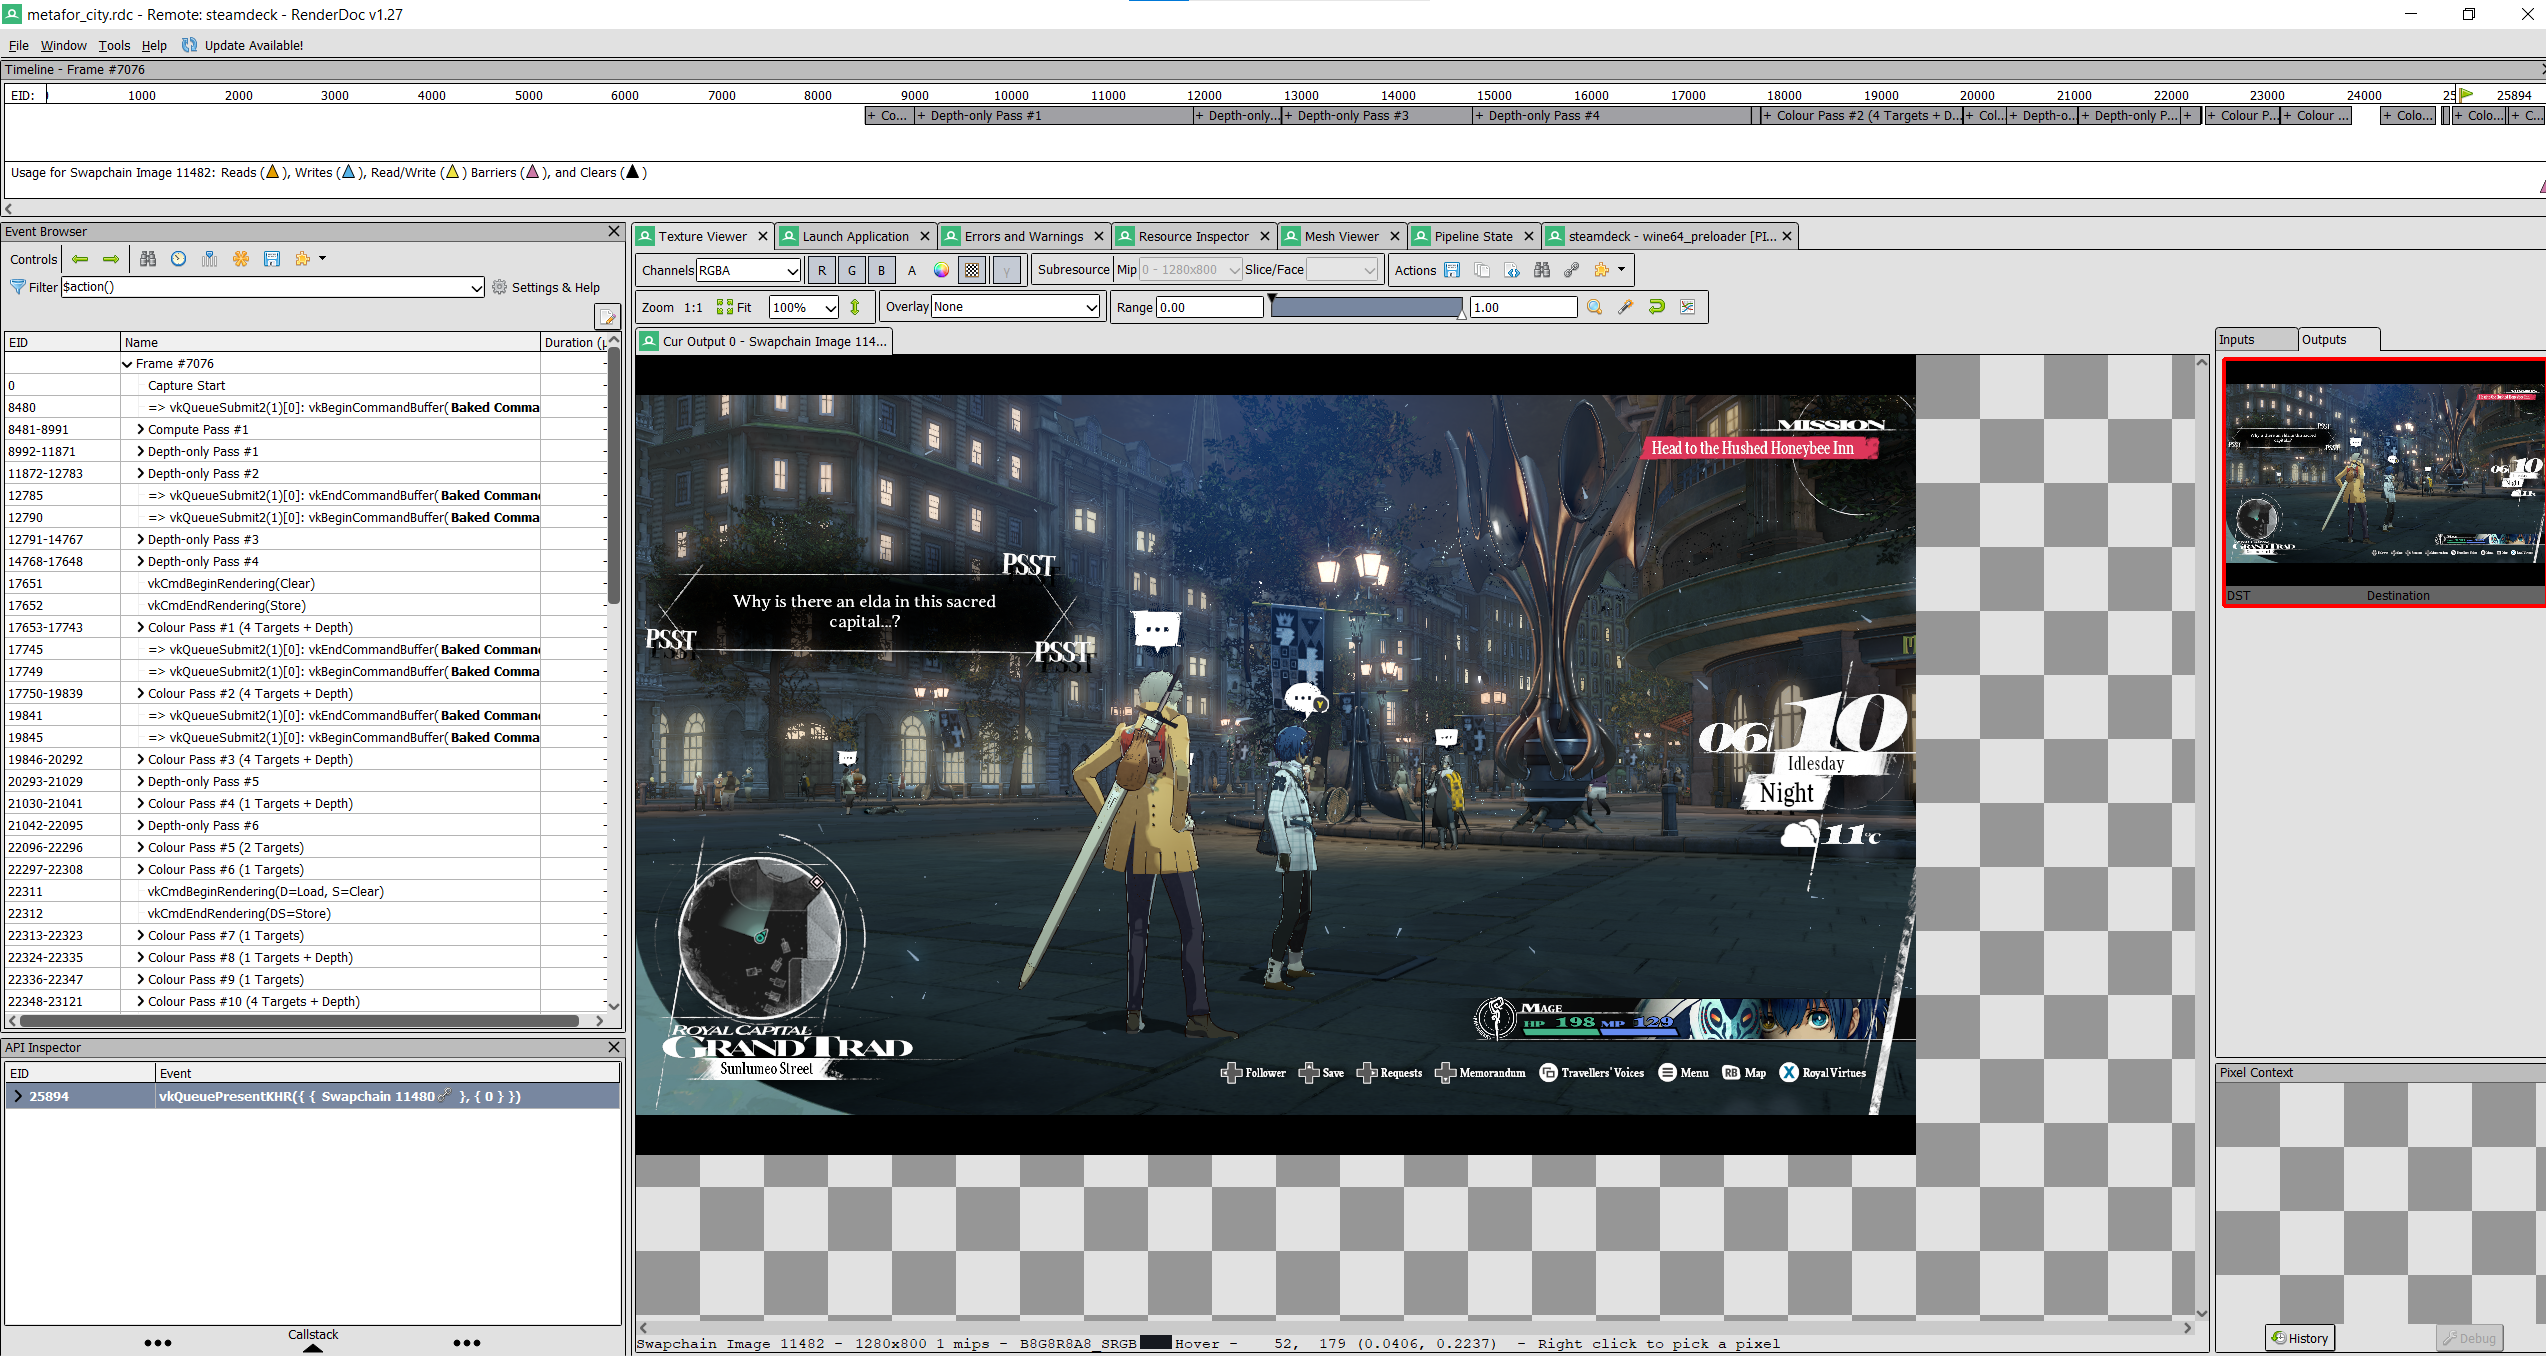 There are a LOT of draw commands in here. The final output, a 1280x800 image mostly as we could expect.
The game begins with a compute pass where it runs a bunch of compute shaders. 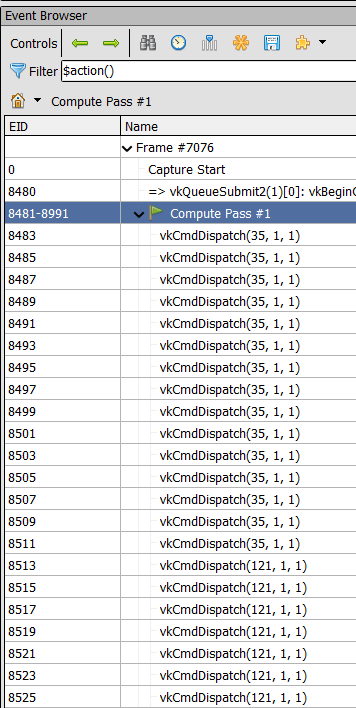
What these shaders do, I have no idea, as we don’t have access to the original shaders or any debug information that could give us a hint. What can be seen, is that they are shaders that do work purely on data buffers, and not textures. Most likely, they are something like GPU particle calculations and skinning calculations for the characters. We are not going to see ANY further usage of compute shaders in this engine. Given how the city renderdoc capture has more of that initial compute than the rest area that has only 3 characters, the more likely option is that those compute shaders are used for precalculating the animated character poses.
The next thing to see, is multiple depth-only passes. These are cascaded shadowmaps, rendering the scene from the sky so that later in the frame they can be used to calculate the sun shadows. 3 of them. Suspiciously far too many commands here for what we see, but we will check that later.
Here are the different shadow maps. Each of them is a 2048x2048 D32S8 format texture. 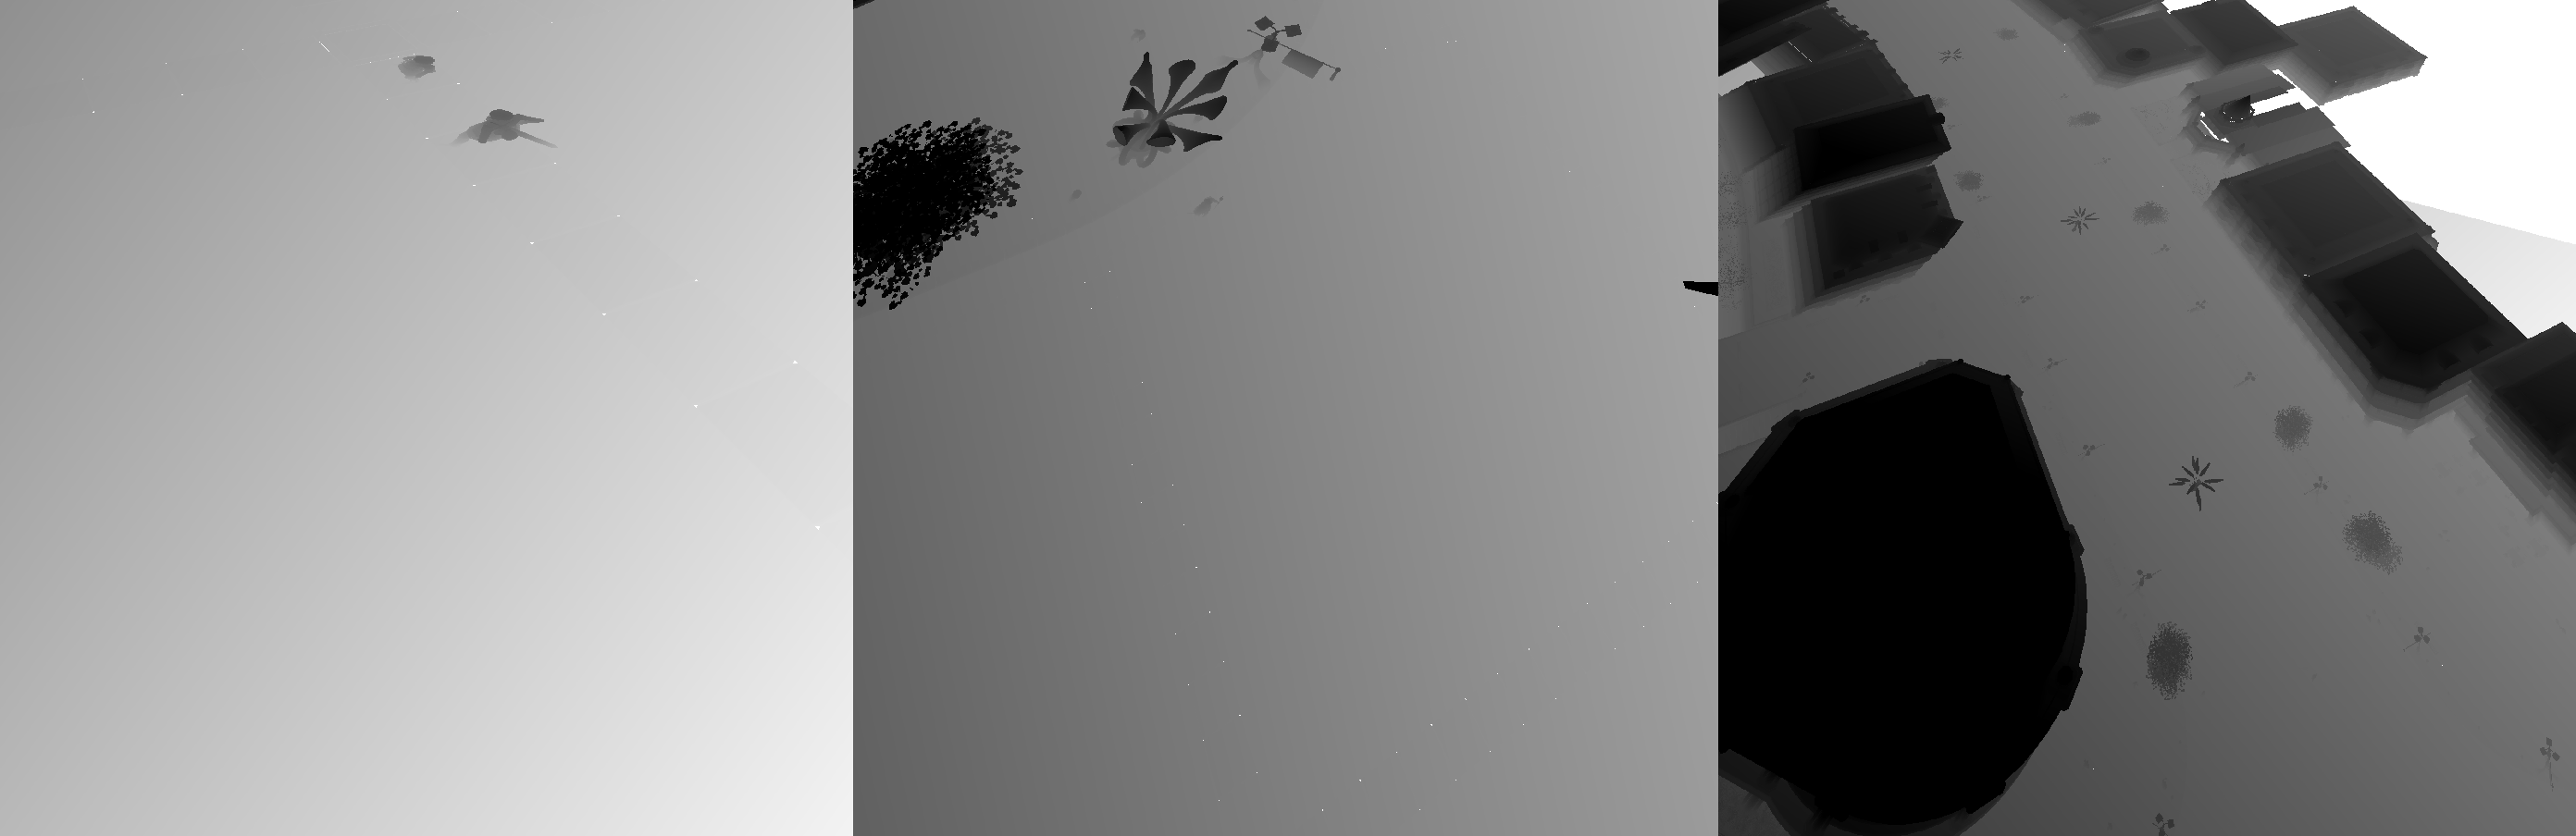
The characters on one of the 3 cascades can be seen if one pays attention, and the last cascade draws most of the map.
After rendering the shadows, the game renders the main environment into a set of GBuffers, using a classic deferred rendering scheme. 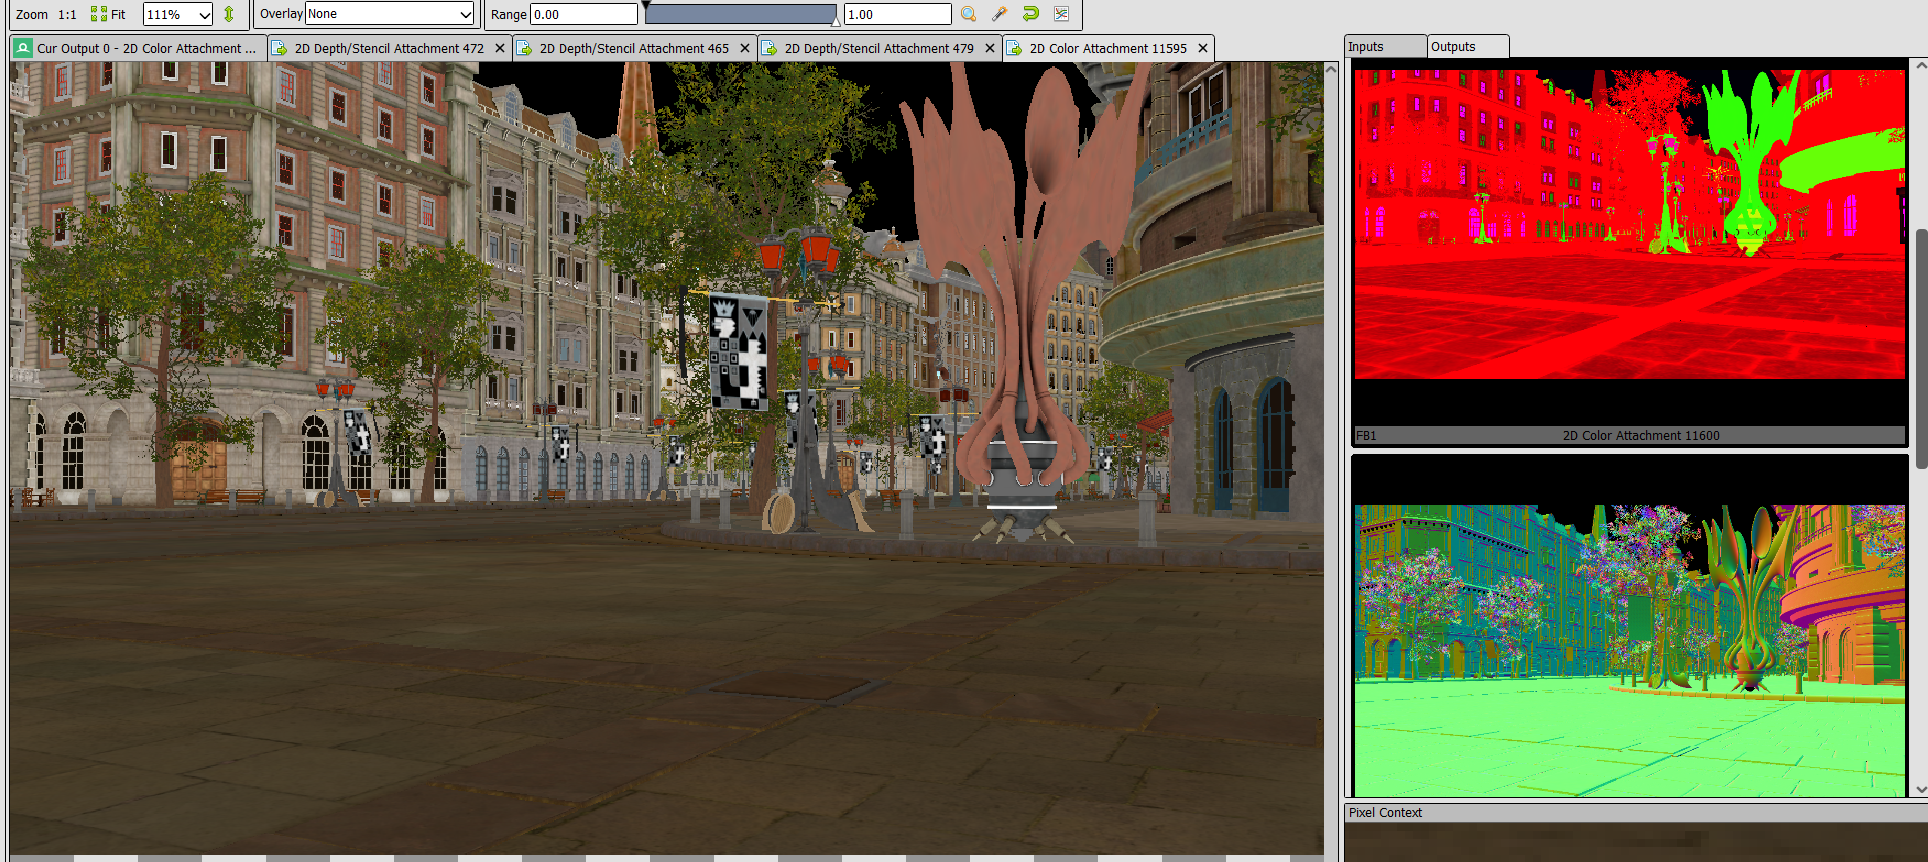
The one in the full image is a RGBA 8 bit color, that contains the main texture of the objects. Then we have another gbuffer that stores material properties at format RGBA 8-bit, which seem to be roughness and metallic. The windows here can be seen on a pink color, so it seems it also selects between multiple materials. Next we have a normal gbuffer of format RGBA16f, which is a considerable mistake, as its using a considerably overkill format for normals. Normally a gbuffer normal will be encoded as RGB 8-bit (no alpha), or RG 16 (2 channels) with a encoding such as octahedral. So the game using RGBA16f is using twice the memory than it needs to. On a platform as constrained as the steamdeck, this is not good, and its dependant on the game resolution, which means this memory usage directly scales with the draw resolution. Not pictured above, but there is also a scene-depth texture using 32 bit float. This contains the distance towards the camera, and is a copy of the z-buffer under a different number scale (seems to be on ingame-units instead of from 0 to 1). For this, there is no need to draw it here, as one could do it as a separate step where we load from the native depth buffer into this distance gbuffer, saving a lot of pixel write bandwidth on this.
The next pass is a depth-only pass where it draws the characters and other non-environment objects into the depth buffer. This combines the characters into the depth buffer for processing later. 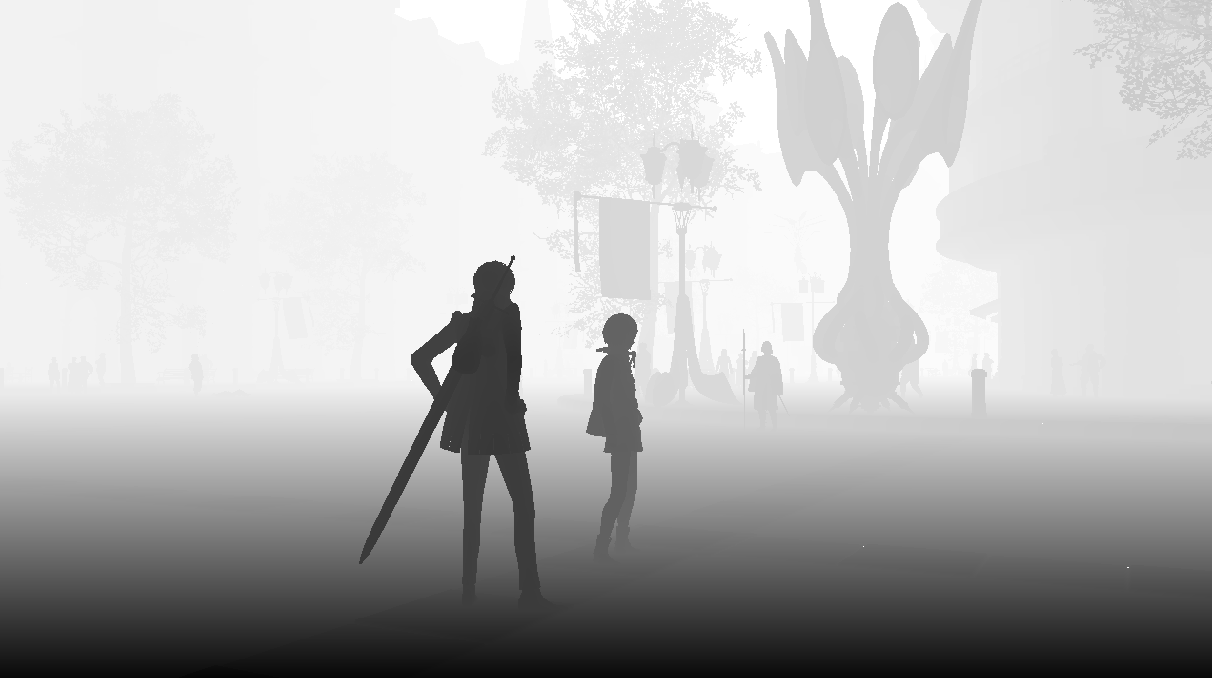
Now we begin with the deferred lighting. This seems to be bugged, as it first begins with drawing each light as a sphere, and setting the pixels that light covers into a stencil value. Once this is done for every light, it then draws the lights again, and their pixel shader applies the light to the pixels the sphere covers.
That first pass is not used on the second, so this first pass setting the stencil values is completely useless. This is likely a bug on the developer side, and its going to cost us significant performance on the deferred lighting, which we will check later. This first pass of setting stencil values could likely be completely removed and have no result on the final image.
 On this image we can see what a light does. A sphere is drawn that covers the bounds of the pointlight, and it applies light to the pixels inside it. There is no culling for the lights, so every single pointlight on the scene will draw its sphere, even if its offscreen.
Once all of the point lights are rendered, it applies a full-screen quad that draws the global light of the scene, and applies sun lighting. 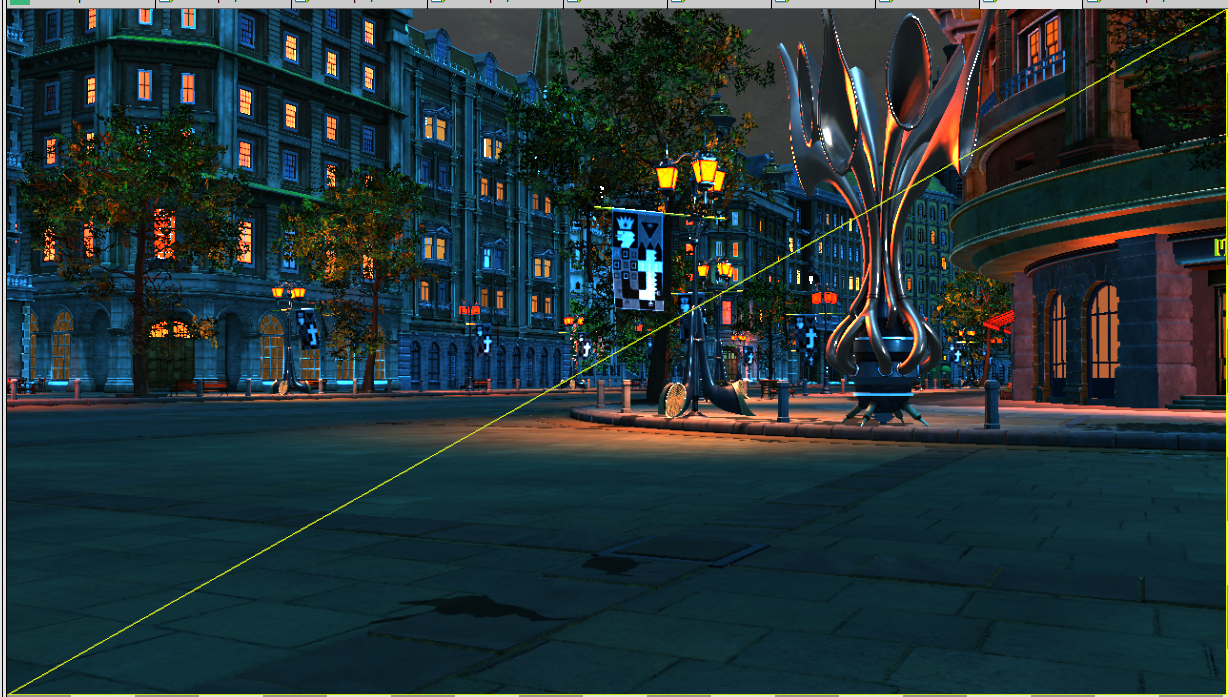
We are going to see a LOT of these full-screen quads. The game doesn’t use compute for drawing, and instead opts to use full-screen quads that do that logic in the pixel shader. While doing this is OK if you really need to run that logic on all pixels, this engine likes to do postprocessing and effects as layers and layers of full-screen quads with low performance.
After the global light, we see another 3 full-screen quads one after another. One of them draws a sky/background using a lower resolution image, the other applies the background on top of the full resolution one, and the 3rd applies global fog. These are all subtle, so they look very similar to the image above.
Next, it draws the characters on top of the fully rendered background we have. Interesting enough, the characters are much brighter than the environment in this pass. Then the characters are drawn again, to draw their outlines using the common inverted hull method. After that, it looks like this. 
Note the darker background compared to the characters.
Right after, there is another full-screen pass that darkens the characters a bit, and more full-screen postprocess passes. One of the more interesting one is a downsample of the scene that will be used for bloom and some visual effects later. Some of the effects it does is the game outline shader for a drawn effect, depth-of-field blurring the far-away objects (seen clearly on cinematics), or adding a filter to the shadows for a drawn feel.
There is a chain of full screen passes to compose this fancy lens flare effect. These are low resolution at least. Each of the passes uses a lower resolution using a downsampling blur method. Here you can see the final result of this chain. 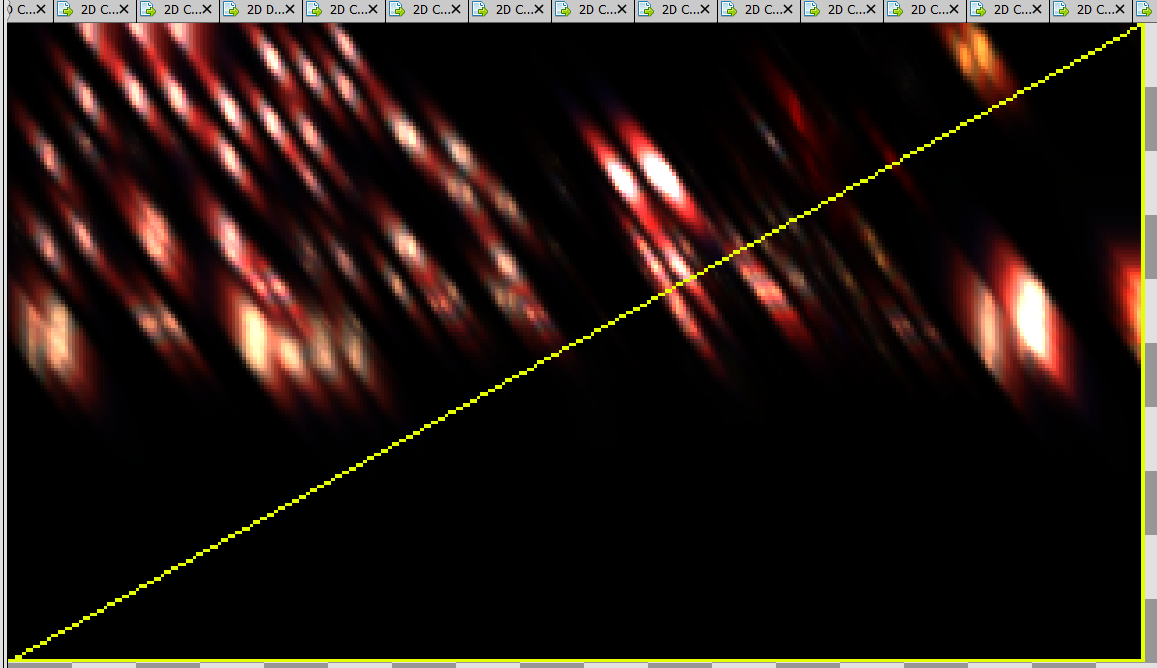
All these get integrated back into the main scene, which no longer has the characters so bright vs the background.
The image has the contrast raised so that we can clearly see the bloom effect on the windows and lights.
Next big pass is vfx and transparents, which results on this. ![]()
The transparent objects are drawn offscreen into a RGBA16f texture, and get composited right after. But of course, not without passing through a few more postprocessing passes to change their lighting and add bloom effects.
Once composited into the main scene, they look like this. ![]()
We are almost done with the frame now. The next thing is user interface and things like speech bubbles, with results on the final scene.
When rendering the text, it does 1 drawcall of a single quad per letter, which is suboptimal. A lot of the UI does this, and it ends at a fairly high number of draws in total.
All of these rendering passes are at 720p resolution, while the steam deck is at 800p, so as the last thing in the frame, it copies it to the final display image, getting the final look with the black borders at the top and bottom. Those borders are not artificial or drawn over, the game just doesn’t render at the aspect ratio of the steam deck, and chooses to do all its rendering in the common 720p resolution and then copies to the final image. While doing this final copy, it applies gamma correction and brightness to create the final image.
We now have gone through the whole frame, and already identified a few strange parts that could be a performance bottleneck, or not. Renderdoc is not a profiler, but a system to understand what’s going on. To really profile it, we need to continue in Radeon GPU Profiler, doing a capture at the same location.
Analysing the performance
After loading the capture, we get greeted with this timeline. 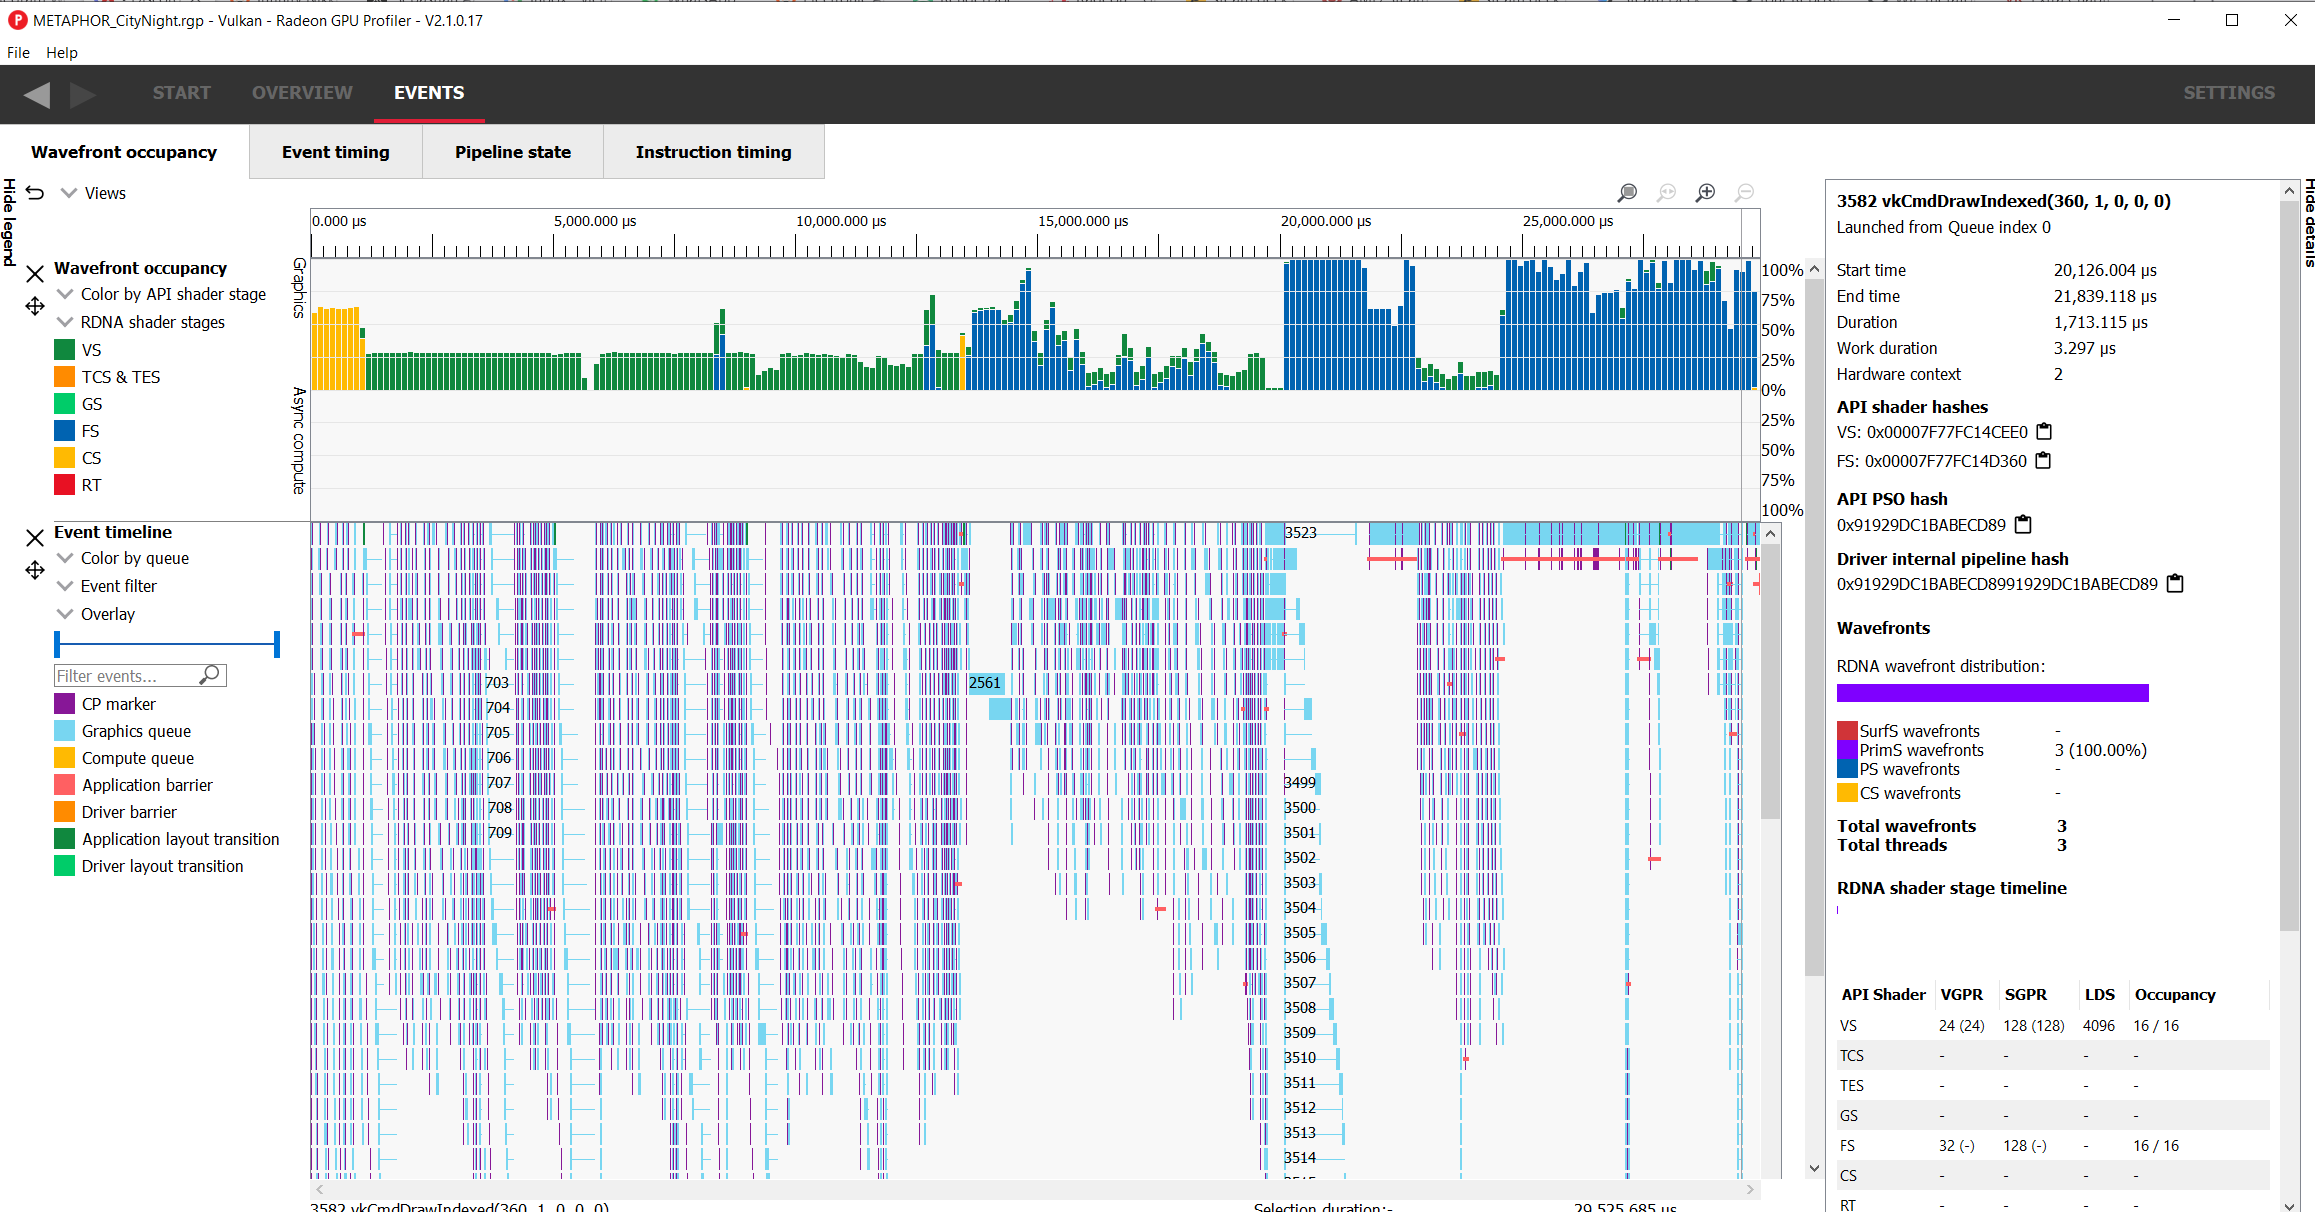
At the top, we have the wavefront occupancy view. This is a global chart of the “usage” of the GPU. Taller bars mean more of the GPU is being used, and their color depends on what the GPU is executing at that point. We can see that for the first half, we are under very low usage, specially in the first 14 milliseconds where its all vertex shader invocations for some reason. Then there is an area with low occupancy but a mix of vertex and fragment shaders, and then we have 2 blocks of heavy fragment shader usage. The frame begins with 1 ms worth of compute shaders, which are those mysterious compute shaders we first saw in renderdoc.
Now we need to try to identify what those parts of the scene actually do, so lets check the command stream, and try to sync it with what we analysed in renderdoc.
After comparing the draws and timeline, all of those initial vertex shader sections are from the shadow rendering, where it spends a total of 12.5 milliseconds to render the 3 cascades. We can even see those 3 “sections” in the performance timeline easily as 3 blocks of vertex-only shader work. So what exactly is going on here? A game that runs at 60 fps needs to draw its whole scene in 16.6 milliseconds, and we have shadows here, just 3 cascades, in 12.5, completely bloating the budget we have for the frame.
If we select the area of those shadows, we can see on the right what RGP says.
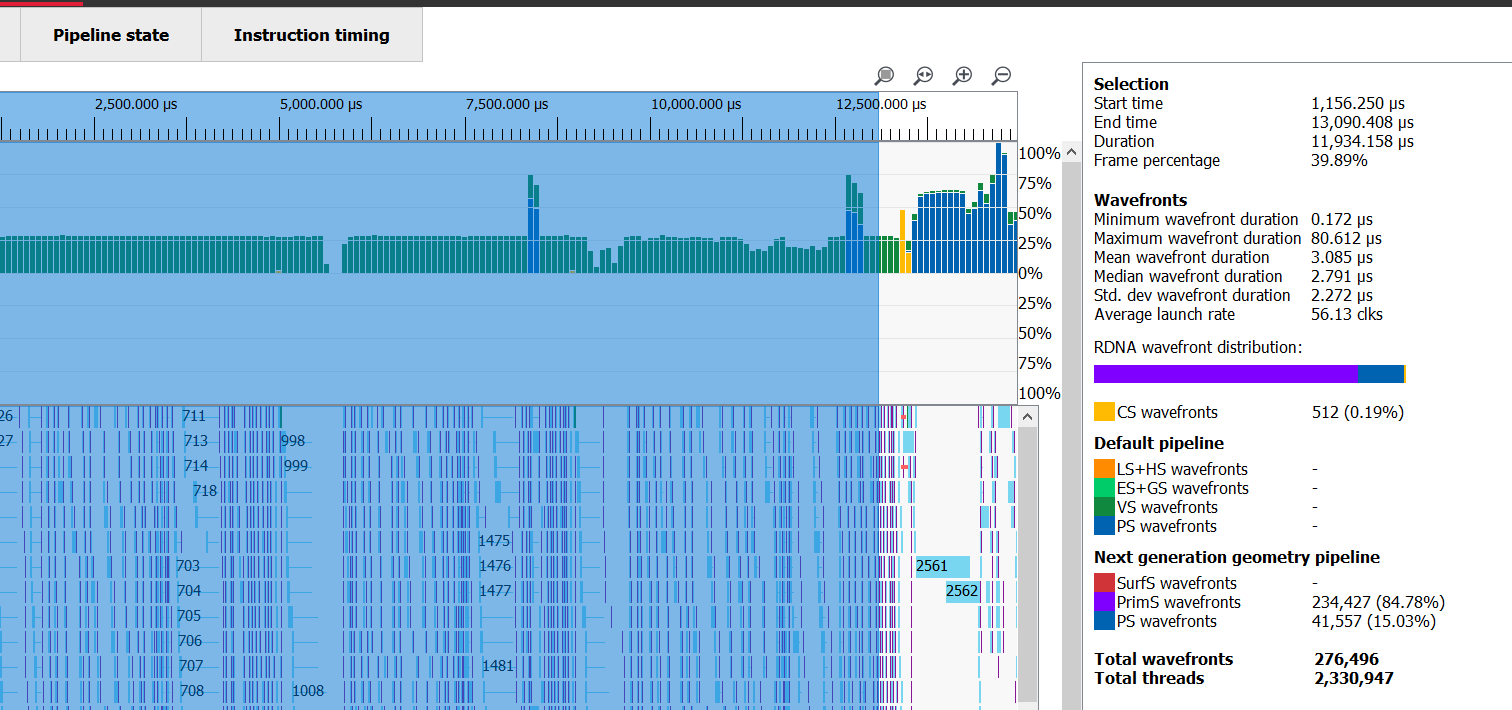
RGP says its most of the work being executed is primitive shader invocations, which is basically vertex shader. Very few shader invocations are being done executing pixel shaders, only 15%. Lets go back to renderdoc, and see in more detail what are those shadows drawing.
Something interesting comes to view, and it is that the 3 shadows are rendering the exact same objects, in the same order. But each of the cascades is rendering a considerably different image. One of them is close to the characters and only renders characters + a bit of ground, while the far scale one draws most of the city. Turns out, that the game does not do any sort of culling for its shadow casting. Even the small shadow cascade gets thrown every single object in the map at it. This is crazy, and its what results on the timeline we are seeing on RGP. So much geometry is being sent to the GPU to draw those cascades, that the entire execution is completely bottlenecked on pure triangle processing in the vertex shaders. Even if the objects are offscreen, it still needs to execute their vertex shaders, which shows as that 85% vertex-shader execution invocations in the profiler. Its rare to be bottlenecked by vertex shaders in a modern engine, as normally its always the pixel shaders that require the most calculations. Being bottlenecked by vertex-shader is almost always a sign that the game is sending too many and/or too dense meshes to the GPU.
With correct culling in here, the only shadow cascade that would be expensive to draw would be the far distance one, while the other 2 would be very cheap to draw. An estimate is that it would probably make the time for shadows to go from 12.5 milliseconds down to 4 milliseconds. Still expensive, but then it could also render the shadows at a lower resolution, as 3 2k resolution shadows is a bit on the expensive side. Even then, the biggest bottleneck is the raw amount of triangles thrown at the GPU for these shadows. For a low resolution machine like the steamdeck, 3 2k resolution shadowmaps is way too high detail, after all we are rendering 12 million pixels worth of shadows for a main-screen of 1 million pixels. 1024x1024 shadow resolution, or even less, would look the same.
Comparing with the captures on the other 2 zones it shows similar results. This is a engine-wide issue and likely happens on every map. On the night camp map, the shadows are particularly expensive to draw as it has a lot of highly dense vegetation meshes, making it even worse.
The next zone we can identify is the gbuffer environment draw. This one also has low occupancy overall, but a less extreme vertex bottleneck. It takes around 4 milliseconds to draw the background, and another 2 milliseconds to draw the characters in the city scene, where there are a lot of NPCs.
On the background, there are some draws that are slow in a strange way. While most of the draws take very little amount of time to execute, 2 specific draws, on this city scene, take 1 milisecond by themselves. Looking at them in renderdoc, they are ground terrain draws, and have a different and more complex shader than the other meshes. I don’t really know what the shader is doing, but the profiler tells us that it has low occupancy, with it being at 10/16 on the fragment shader, and 12/16 on the vertex shader. Looking at the other capture, in the desert, is even more dramatic. On that desert, the terrain mesh is bigger and covers a lot more of the screen, so it ends up costing 3 milliseconds by itself.
If we looked at the original shader, its likely we could find a way to optimize it a little bit and make it faster, which would give a bit of extra perf. The other draws use simple shaders and are fast to run, there is just a lot of them and they are fairly heavy in polycount. RGP tells us that we have 97% of the gpu work on the pixel shader, so whatever those terrain shaders are doing, their pixel shader is extremely heavy and its the main cost, with the vertex shader not mattering much.
Similarly, there is nothing really out of the ordinary on the character draws. They are forward lit, but their shaders are not really that complicated, and they are high in polycount due to fidelity. They get rendered twice due to their outlines. Only scenes with a huge amount of characters in scenes like the city really sees that section taking a lot of time. On the rest area map, with only 3 characterrs, this section doesnt take long to draw.
There is one issue, and is the gbuffers. The normals are stored in a 4 channel 16 bit per channel float texture, but normals do not require this. Most games store normals as rgb 8 bit, with then using the 4th alpha channel for something else. Alternatively, one can use a 2-channel 16 bit texture, but use octahedral encoding for those normals, halving the size required while improving quality vs the 8 bit 3-channel. When doing a gbuffer, the biggest performance bottleneck is always memory bandwidth due to the data you end up storing per pixel, so trying to find the most optimal way of encoding that data saves a lot of performance.
Continuing down the render pipeline, we reach the section of the deferred lighting. Above, I mentioned that we would be looking at this. The deferred lighting takes 2.5 milliseconds. 2 milliseconds for the spherical point-lights, and half a millisecond for the ambient/sun light, which is rendered as a full-screen quad.
This is simply way too slow. This sort of light uses simple formulas, and the steam deck is powerful enough to draw thousands of fancy math PBR lights if used properly. This lighting is slower than stuff like Cyberpunk or Elden Ring. So what is going on here?
The issue is yet again, due to bandwidth and the overdraw caused by the lights.
 Renderdoc can select a display mode “Overlay: Quad Overdraw (pass)” option to check the overdraw of a given renderpass. This goes through the colors of the rainbow towards white depending on how much the geometry in the scene overdraws. If you have light blue, its already a warning. this goes much further beyond.
The deferred rendering here is broken, with it not doing the stencil part properly, and each light drawing a transparent sphere with depth testing disabled that will run the math on every single pixel inside it. This is a common but pretty bad way to implement deferred lights (its how this tutorial does it), and a simple bruteforce algorithm would significantly outperform it.
The overdraw here is considerable, and the bandwidth used is massive, as for every pixel in those sphere draws it needs to load all of the data from the gbuffer (which is already bigger than it should be!) and write the light value back. To improve this, the developers could implement a simple full-screen quad with a bruteforce shader (the simplest possible, loop every light at every pixel), and it would drop that 2.5 ms perf usage down to 0.5 or so. Their amount of lights is fairly low for what I can see, so it doesn’t matter much if its looping through every light in the shader. Could also do a tiled-deferred scheme or other similar more advanced deferred light algorithms to improve perf further even on the scenes that have a lot of lights. This article explains such fancy techniques nicely.
Once characters and background are rendered, we enter the final section of the frame, with transparencies, postfx, and UI. This takes 5.5 milliseconds. Remember the mention of those full screen quads for different effects? Due to memory bandwidth constraints, a full screen quad at native resolution on a steam deck will take between 0.25 and 0.4 milliseconds by itself, and we have quite a few here.
A lot of the postprocessing and several effects apply layers of effects on top of each other, each as a full-screen quad. This means that at every one of them, it needs to load the memory for those pixels, do the postprocessing calculations, and store it back. If instead of this it did it in 1 quad (or compute shader) that does multiple things at once, its likely to be a significant performance win. The transparency and vfx draws here dont take much time, basically negligible at the side of the full-screen quads. Of those 5.5 milliseconds of transparency, postfx, and UI, around 3.5 to 4 of them are spent due to the overhead of doing full-screen quads over and over. A lot of those do make sense and are needed as they are, like for the bloom lighting effect, but that entire pipeline could be significantly optimized by merging shaders.
With this whole analysis, how fast could the game run? Assuming no changes on assets, just optimizing the rendering code itself.
The biggest win of all would be the change to the shadows. It can save 8 milliseconds by fixing the culling, which should be a simple code fix. Improving the gbuffer layout compressing memory would save RAM, and will probably drop around half a millisecond from the gbuffer and character passes, while also improving the next render systems another half ms. Fixing the terrain mesh and its shader would save 0.5 ms to 1 ms, depending on scene. Going from overdraw-hell deferred lighting into a bruteforce algorithm or a fancier scheme would save 2 milliseconds, and improving the postfx pipeline by merging shaders would save 1 to 3 ms more. The total would be 12 to 15 milliseconds saved, which would make the game render almost 2x faster. At that level, the game would stay at 60 fps on most places in the game on the steam deck. Most of these things apply to PS5 too, assuming the render code is similar, so we could see it running at native 4k in there at 60 fps. More perf could be saved by doing things like rendering the shadows at a bit less resolution, offering it as a option in settings. In the same way, removing that 3rd shadow cascade as an option would save another 1-2 ms from the game and would be great for most of it as a low end option, but it does change the image quality.